
Page 11 - An ultrasound-driven immune-boosting molecular machine for systemic tumor suppression
P. 11
SCIENCE ADVANCES | RESEARCH ARTICLE
+
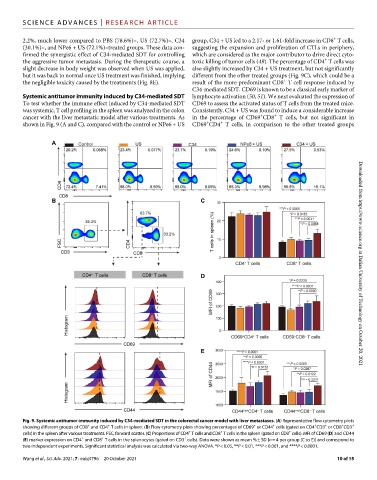
2.2%, much lower compared to PBS (78.6%)–, US (72.7%)–, C34 group, C34 + US led to a 2.17- or 1.61-fold increase in CD8 T cells,
(30.1%)–, and NPe6 + US (72.1%)–treated groups. These data con- suggesting the expansion and proliferation of CTLs in periphery,
firmed the synergistic effect of C34-mediated SDT for controlling which are considered as the major contributor to drive direct cyto-
+
the aggressive tumor metastasis. During the therapeutic course, a toxic killing of tumor cells (49). The percentage of CD4 T cells was
slight decrease in body weight was observed when US was applied, also slightly increased by C34 + US treatment, but not significantly
but it was back to normal once US treatment was finished, implying different from the other treated groups (Fig. 9C), which could be a
+
the negligible toxicity caused by the treatments (Fig. 8E). result of the more predominant CD8 T cell response induced by
C34-mediated SDT. CD69 is known to be a classical early marker of
Systemic antitumor immunity induced by C34-mediated SDT lymphocyte activation (50, 51). We next evaluated the expression of
To test whether the immune effect induced by C34-mediated SDT CD69 to assess the activated status of T cells from the treated mice.
was systemic, T cell profiling in the spleen was analyzed in the colon Consistently, C34 + US was found to induce a considerable increase
+
+
cancer with the liver metastatic model after various treatments. As in the percentage of CD69 CD8 T cells, but not significant in
+
+
shown in Fig. 9 (A and C), compared with the control or NPe6 + US CD69 CD4 T cells, in comparison to the other treated groups Downloaded from https://www.science.org at Dalian University of Technology on October 20, 2021
Fig. 9. Systemic antitumor immunity induced by C34-mediated SDT in the colorectal cancer model with liver metastases. (A) Representative flow cytometry plots
+
+
+
+
+
+
+
+
showing different groups of CD8 and CD4 T cells in spleen. (B) Flow cytometry plots showing percentages of CD69 or CD44 cells (gated on CD4 CD3 or CD8 CD3
+
+
+
cells) in the spleen after various treatments. FSC, forward scatter. (C) Proportions of CD4 T cells and CD8 T cells in the spleen (gated on CD3 cells). MFI of CD69 (D) and CD44
+
+
+
(E) marker expression on CD4 and CD8 T cells in the splenocytes (gated on CD3 cells). Data were shown as mean % ± SD [n = 4 per group (C to E)] and correspond to
two independent experiments. Significant statistical analysis was calculated via two-way ANOVA. *P < 0.05, **P < 0.01, ***P < 0.001, and ****P < 0.0001.
Wang et al., Sci. Adv. 2021; 7 : eabj4796 20 October 2021 10 of 15